Oh no! The PLC has crashed, and we might even see the classical blue screen of death (BSOD). We’ve all been there, and there are many reasons for why we got there. TwinCAT is generally good at handling exceptions, and most of the time it is possible to analyze exceptions during development of software for a machine. On a few occasions though, I’ve been in the situation where the machine has crashed, and I have not been connected to it at the moment of the crash and without any possibility to see what caused it. In the latest version of TwinCAT (3.1.4024.11), Beckhoff have included a tool to aid with this type of problems.
Although it would be convenient to have a developer PC connected to a machine all the time in order to see what has happened if we get a PLC crash, this is very unpractical and most often not even possible. What Beckhoff have included instead now is a dump of the complete PLC project with the complete state of the variables at the time of the crash. This dump is stored on the PLC, so it’s possible to retrieve it after the crash has occurred. To be able to use core dumps there are two requirements that you need to make sure are fulfilled:
- The project is running 3.1.4024.11 (or later)
- You have access to the associated compileinfo file for the project that has crashed. This file is generated during compilation and is available on your TwinCAT 3 developer machine in the folder for the respective PLC-project (and there is one file for every PLC project if you have more than one PLC project in your solution)
For (2) above, if you are doing your version control properly you should be able to reproduce the compileinfo file matching with what is running on a target device. As we however have learned it’s not always easy to reproduce a build matching a target device to 100%, so if you want to be on the safe side Beckhoff have included a new option in 4024.11 that makes sure that this file is also transferred to the target system.
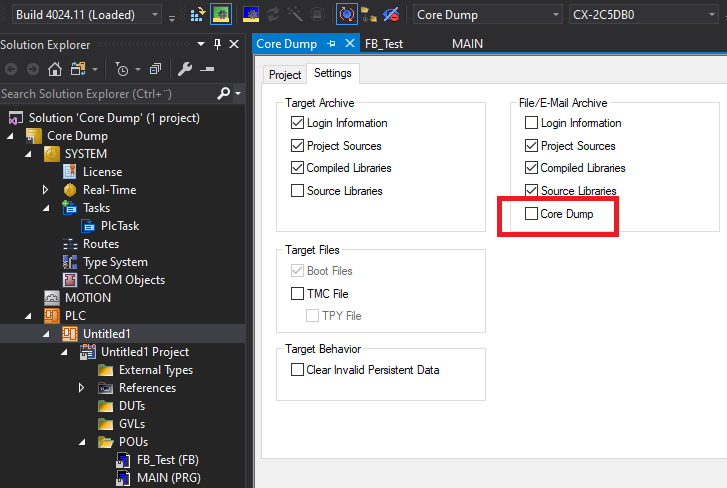
I would however like to note that I haven’t figured out where this file is stored in the target, so to be absolutely sure to be able to use the core dump, make sure to keep proper track of your software versions.
To create a core dump and analyze it, I’m going to create a very simple example program.
PROGRAM MAIN
VAR
    JustAnInteger : INT;
    AVeryBigFloat : LREAL := 3.0E100;
    nCounter : ULINT;
END_VAR
---------------------------------------------
nCounter := nCounter + 1;
JustAnInteger := LREAL_TO_INT(AVeryBigFloat);
The execution of LREAL_TO_INT(AVeryBigFloat) will fail, as we can’t fit this large number into a INT and an exception will be thrown on the PLC.
I also added a simple counter nCounter to show that the TwinCAT XAE will show us exactly on which line the exception occurred.
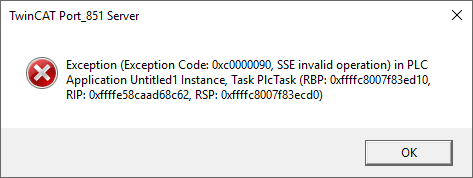
If we execute this program (at the same time not being logged in to the PLC through ADS with the TwinCAT XAE to read variables, as the core dump will not be created then), we get the usual exception window (looking at the desktop of the PLC):
Logging in to the PLC with the TwinCAT XAE will show you a notification that there now is a core dump available on the target:

By logging in to the PLC by remote desktop we can see that this file (Port_851.1786663219.core) is stored in C:\TwinCAT\3.1\Boot\Plc.
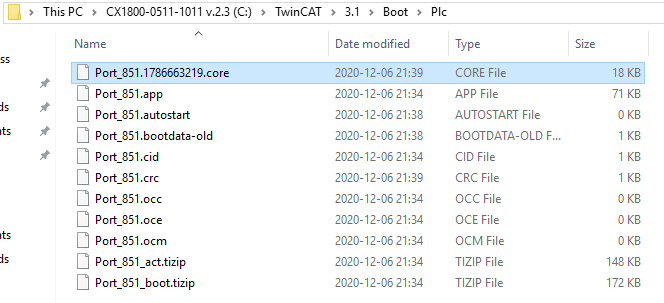
Because a core dump is created for a specific PLC project, you will have a core dump for each project (Port_851, Port_852 etc…) in case you should have several, which is a neat feature. What we need to do next is to simply copy/move this file to our development machine. Note that this file will be stored on the PLC until it is moved/deleted, and even if you get a new crash a new core dump will be created with another name. Once you have done your analysis and concluded what is wrong, I’d recommend to remove this file.
Beckhoff have added a new menu in the TwinCAT XAE related to the core dumps, which is available in the menu of Visual Studio. Open the project and go to PLC → Core Dump → Load Core Dump. Next you get a file selection window, where you select the .core file and open it.

To try this properly, I tried to load the core dump on an entirely different TwinCAT development computer than I used to upload the software to the target, which will probably be a common scenario. In this way we can simply retrieve the file from a machine, and then look at the core dump at the office at our developer PC. After loading the core dump I got the following result:
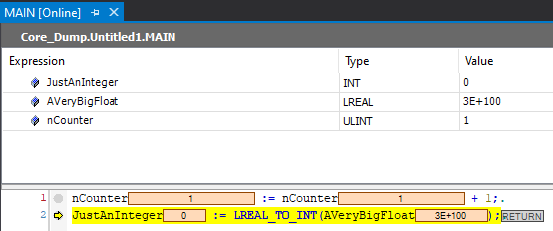
The TwinCAT XAE clearly showed where the error had occurred, just as if I was logged in to the PLC. When you’re finished with the analysis, you close the core dump by going to Core Dump → Close Core Dump.
This new functionality is one of the best Christmas gifts we TwinCAT developers could possibly have gotten from Beckhoff. It’s simply a killer feature and I’ve already made use of it in a production system! Nowadays I don’t get annoyed, angry or even surprised when I get a BSOD. I just remind myself that I’m a human that makes mistakes (all of us do), and I just think that I’m lucky that Microsoft selected the color blue for the background, which happens to be my favorite color.
This will be my last post for this year. Next year I have some great content planned for the blog. I want to take the opportunity to thank all my readers for this year and wish you all merry Christmas and a happy new year!
